There are a number of statistical functions in Excel which can be used to analyse the data in your spreadsheet. These include, but are not limited to COUNT, AVERAGE, MIN and MAX.
COUNT
Returns the number of values from a list.
The syntax for the Count function is:
=COUNT(value1, [value2], ...)
AVERAGE
Returns the average or arithmetic mean of a list of values.
The syntax for the Average function is:
=AVERAGE(number1, [number2], ...)
MIN
Returns the smallest number from a list of values.
The syntax for the Min function is:
=MIN(number1, [number2], ...)
MAX
Returns the largest number from a list of values.
The syntax for the Max function is:
=MAX(number1, [number2], ...)
Entering a Statistical Function in Excel
Select the cell where you wish the result to be displayed.
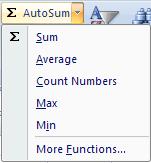
Click the Home tab on the Ribbon, and then click the drop list arrow next to the AutoSum button in the Editing group.

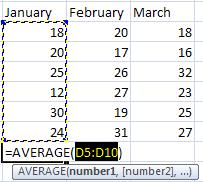
The function will appear and Excel will select a range it thinks you wish to calculate. If this is incorrect select the range you wish to use.
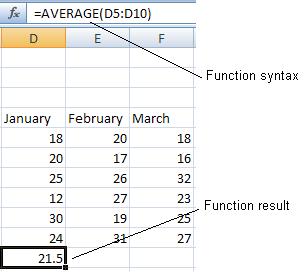
The example below uses the AVERAGE function.

Press Enter. The result appears in the cell and the function can be seen in the formula bar.

These statistical functions follow the same syntax as the SUM function. It is possible to select more than one range of values to calculate. To do so, separate each cell range with a comma.


