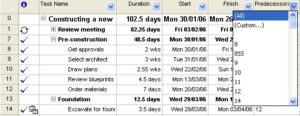
Microsoft Project has two ways of filtering its’ tables. There is the AutoFilter, similar to what you would see in Excel, and there is the in-built filters.
Filtering allows you to perform some simple analysis of your project data. It can be used to find which tasks begin this week, which tasks have slipped, or the most expensive tasks.
Using the AutoFilter
The AutoFilter tool allows you to filter using the data in the table. Because Project provides so different tables to view different information about your project. This method of filtering provides a high level of flexibility as it works with the data you are working with.
You can also insert and hide columns to get the information you need in the table to use for your filters.
- Click the AutoFilter button on the Formatting toolbar

- Click the required filter arrow on the column heading that you wish to filter. The image below shows the Predecessors column being used to find all tasks that are dependent upon a specific task

- The column being used for the filter is shown with blue text to make it easy to identify

Using the In-built Filter Tool
The Filter tool that comes with Microsoft Project provides predetermined filters to cater for all the common filtering requirements.
Click the Filter list arrow on the Formatting toolbar

Select the Filter you want to use
The filter will be performed. It may require further input from you. The image below shows the Using Resource filter prompting me to select the required resource from a list

The filtering tools in Microsoft project allow you to perform some simple analysis of project information. For further analysis, you could export the project data into Excel. This would enable you to perform much more powerful analysis of your project data.


Leave a Reply