The report filter is fantastic for analysing Excel PivotTable data. It allows you to filter the PivotTable using any field from your data source.
An awesome feature called Show Report Filter Pages will display each report filter result on a different sheet of your workbook. This works great when there are only a few filter criteria.
This feature always goes down well in training sessions. It allows you to quickly and easily create multiple reports on different sheets of a workbook, based on the criteria you want to use.
Use the Show Report Filter Pages Tool
- Set up the PivotTable as you would like it to look. Add the field to the Report Filter field that you want to use.
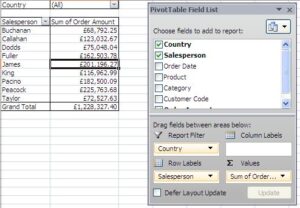
The image below shows a simple PivotTable with the Country field being used in the Report Filter field.

- Click the list arrow for the Options button on the Options tab of the Ribbon and select Show Report Filter Pages.

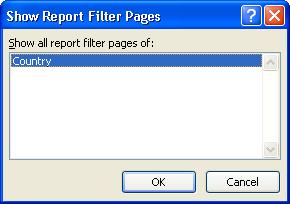
- Select the Report Filter you want to create pages for and click Ok.

- Worksheets will be added to the workbook for each option in the Report Filter.


Leave a Reply