In this blog post, we create a geographic heat map in Excel using a cool free Excel add-in. This add-in is extremely easy to use, meaning you can have an awesome looking geographic heat map on your Excel report in minutes.
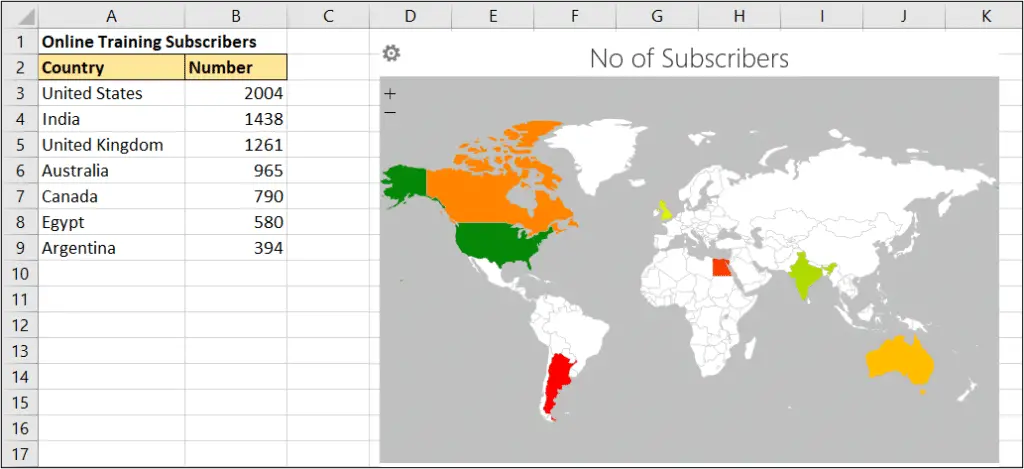
The image below shows the data being used for this example. I have a list of countries and a number of online training subscribers.
This data has been plotted on an image of a world map using a red to green colour scheme.
Watch the Video
Keep reading for the step by step instructions or watch this video as it walks you through the process.
Install the Geographic Heat Map Add-in
The first thing you need to do is install the add-in.
- Click the Insert tab of the Ribbon, and then the Store button of the Add-ins group.
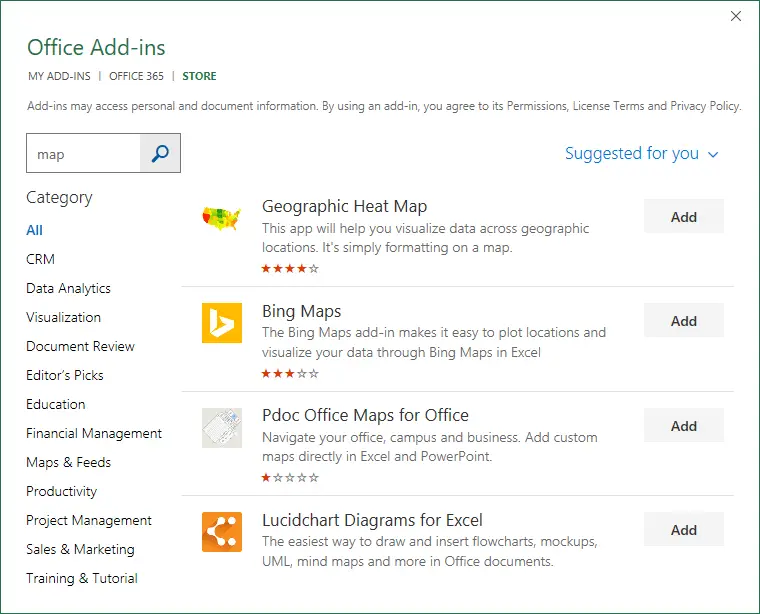
- You can find the add-in that you want by navigating the categories, or by using the search box. In the image below we have typed map into the search box to quickly locate the Geographic Heat Map add-in.
- Click the Add button to start the install. It takes just a few seconds.
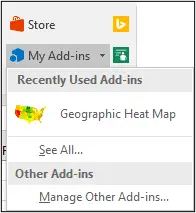
Once an Add-in has been installed, it can be found in your recently used Add-ins list.
Create the Geographic Heat Map
Creating the heat map from your data is now very simple. Check this out.
- Start the add-in by selecting it from the Recently Used Add-ins list.
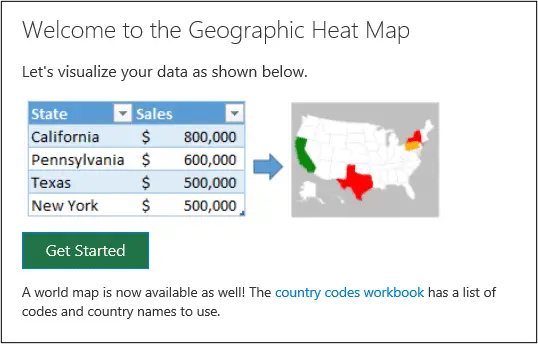
- The welcome screen appears like below. Click on the Get Started button.
- Click the Select Data button and highlight the range of cells you want to use (including the headers). In this example I used range A2:B9.
- Select the map you want to use from the Choose map options. At the time of writing this tutorial you have the option of a USA map or a world map. We want the world map.
- You then need to specify the columns that contain the list of countries and the values that you want to chart. The country names used on the spreadsheet will need to match the names the add-in looks for i.e. the USA is the United States on the map.
- You then select the Color theme that you want. You have the option of Red > Green, Green > Red or Greyscale.
- Then enter a Title for the geographic heat map and click Save.

The geographic heat map is created. It can be moved on the spreadsheet by clicking and dragging the map by its edge.
If the data used on the sheet changes, the map will automatically update.
Pretty awesome I hope you agree. This will make a nice addition to your reports if you work with global data.



I’m on Excel 2010. I can’t find how get the Store Add-in on the Insert ribbon – how the heck do I do that?
Yes I’m afraid this is not available in 2010.
Hi, Store but does not bring me options to download … it stays “blank” …. how can I get the add-ins for heat maps??
Emma
I don’t know Emma, sorry. Do you have an Internet connection?