When using a PivotTable to summarise a large list of data, you may need to count unique values in a PivotTable for a particular field.
For example, you may have a list of data like the one below and want to count the number of different customers in each country, or the number of different products that were sold in each country.
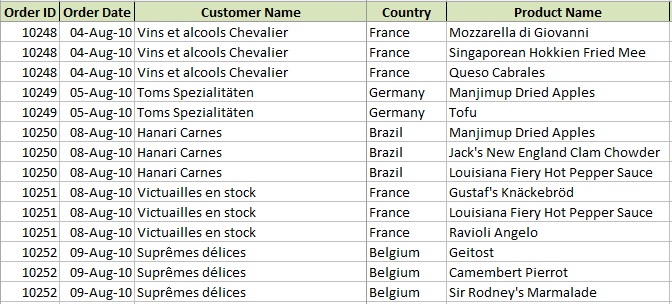
If you added the Customer Name field to the Values area of a PivotTable and summarised it with a Count you would get the result below.
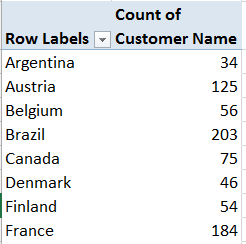
However, this is counting all of the transactions in each country. We need to count the unique customers making those transactions in each country.
From Excel 2013, there is a Distinct Count option in PivotTables making counting unique values a piece of cake. In earlier versions there is a workaround.
Distinct Count in PivotTables
To count unique values in a PivotTable in Excel 2013 or later, we can use the Distinct Count function. To make this function available, you need to ensure that you add the table to the data model when inserting the PivotTable.
- Click the PivotTable button on the Insert tab as normal. Ensure the correct table/range is selected and that the Add this data to the Data Model box is checked.

- Build the PivotTable by moving the fields into the required areas. In this example the Country field is moved to the Rows area, and Customer Name to the Values area.
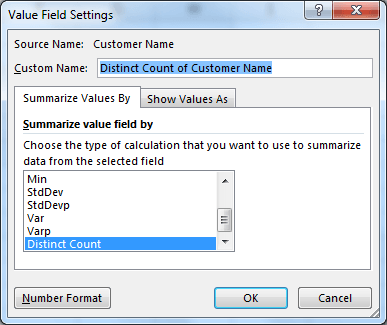
- Right click on one of the Customer Name values in the PivotTable and select Value Field Settings. Choose Distinct Count from the bottom of the list of functions.
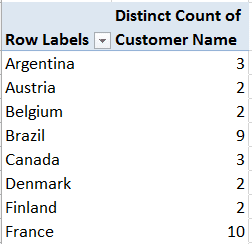
- The PivotTable now displays a unique count for each customer in the data source and groups them by country.
Watch the Video
Count Unique Values in a PivotTable Before Excel 2013
Because the distinct count option is not available in Excel 2010 and earlier you need to use a workaround.
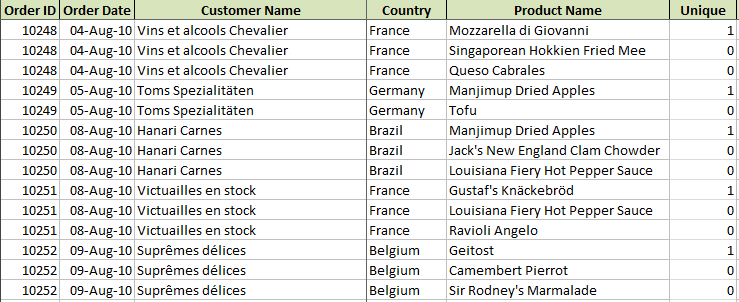
Add a new column to the data source table using a formula like the one below.
=IF(COUNTIF($C$2:$C2,C2)>1,0,1)
In this formula, column C contains the customer names. The COUNTIF function is used to count how many times that customer name appears in the list until the current row. If it has not appeared yet a number 1 is assigned, and if it has already appeared (not unique) a 0 is assigned.
The image below shows this formula applied to the data source.
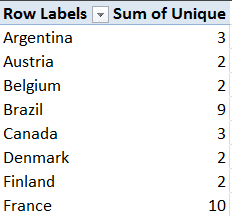
This column can then be summed in the PivotTable to return a unique count for each customer by country.


Is there a way to select “add this data to the data model” via VBA? I’m using 2016.
It will surely be possible, but is not something I have done.
I would record the process to generate some code, and then edit the code to work the way you need it.