Add drop lines to a line graph in Excel to connect the data point to its label on the axis. This extra visual chart element can make it easier to view the data on busy charts.
Take the line graph below for instance that shows the call volume for 14 hours of a day. It can be awkward on this chart to quickly view the time of day for a specific data point.

Add Drop Lines to a Line Graph
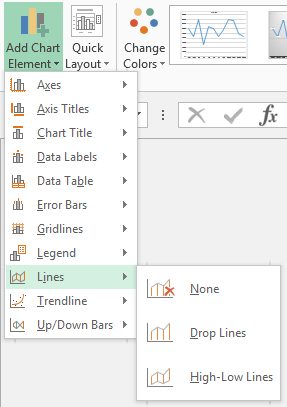
To add drop lines to this line graph in Excel;
- Click the Design tab under Chart Tools on the Ribbon.
- Click the Add Chart Element button.
- Select Lines and then Drop Lines.
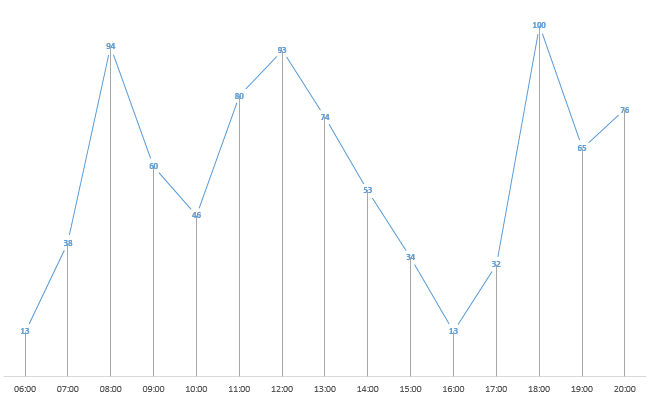
The image below shows the chart with drop lines added.
Add Drop Lines to a Line Graph in Excel 2010 and Earlier
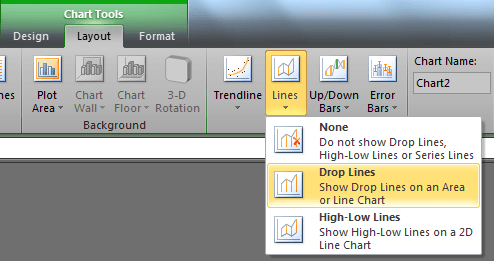
Drop lines are not a new feature, and can therefore be added in older versions of Excel also. In Excel 2010;
- Click the Layout tab under Chart Tools on the Ribbon.
- Click the Lines button and then select Drop Lines.



Leave a Reply