Custom Fields in Microsoft Project allow you to define your own fields (columns) for data that meets your organisation needs.
By creating your own custom fields you can display information on the project plan that is tailored to your requirements.
This tutorial looks at 5 reasons you may want to set up custom fields in Microsoft Project including creating drop down lists and using formulas in fields.
- Create a drop down list
- Display multiple fields next to task bars in Gantt Chart
- Sum the total duration of tasks
- Change colour of task bars dependent upon conditions
- Using graphical indicators in custom fields
Create Drop Down List Fields in Microsoft Project
If there will only be a set number of entries for a field, you could create a custom field and set up a drop down list (known as a lookup table).
Setting up drop down list fields can make data entry easier and more accurate.
Display Multiple Fields Next to Task Bars
By default, the Gantt Chart will display the names of resources to the right of the task bars. You are able to edit this to display the information that you want.
However, you are only able to display one field of information to the right of the task bar. You do have the option of displaying extra information to the left, above, below or in the middle of the task bar, but this begins to clutter the chart.
A better alternative is to create a custom field and use it to concatenate different fields together. You can then display multiple fields next to the task bars.
Sum the Total Duration of Tasks
The duration field is used in Microsoft Project to display the difference between the start and finish dates of a task. But what if you want to show the total duration for a set of tasks?
It is possible to create a custom field to sum the durations of a set of tasks. This is done using a rollup function.
Change the Colour of Task Bars Dependent upon Conditions
Microsoft Project can automatically change the colour of a task bar dependent upon a condition such as the tasks location, resources or priority.
Sadly this feature is not built into Project, but we can create this behaviour using custom fields.
The video below shows how to get Microsoft Project to automatically change the colour of a task bar dependent upon the resource group being used.
Using Graphical Indicators in Custom Fields
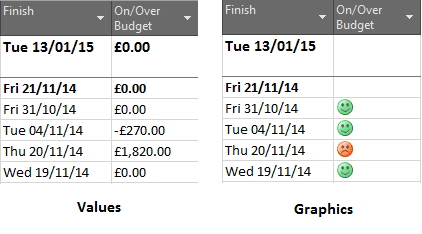
Graphical Indicators can be used to make viewing the status of a numerical field easier. A coloured graphic is displayed instead of the value so that its status can be understood at a glance.
Graphical Indicators can be used in a project plan like conditional formatting rules on an Excel spreadsheet.


Leave a Reply